RESOURCE
PipMaker A Web Server for Aligning Two Genomic DNA Sequences
Departments of 1 Computer Science and Engineering and 5 Biochemistry and Molecular Biology and Center for Gene Regulation, The Pennsylvania State University, University Park, Pennsylvania USA 16802; 2 Genome Sciences Department, Lawrence Berkeley National Laboratory, Berkeley, California USA 94720; 3 Axys Pharmaceuticals, La Jolla, California USA 92037; 4 Department of Molecular and Human Genetics, Baylor College of Medicine, Houston, Texas USA 77030
| |
ABSTRACT |
|---|
|
|
|---|
PipMaker (http://bio.cse.psu.edu) is a World-Wide Web site for comparing two long DNA sequences to identify conserved segments and for producing informative, high-resolution displays of the resulting alignments. One display is a percent identity plot (pip), which shows both the position in one sequence and the degree of similarity for each aligning segment between the two sequences in a compact and easily understandable form. Positions along the horizontal axis can be labeled with features such as exons of genes and repetitive elements, and colors can be used to clarify and enhance the display. The web site also provides a plot of the locations of those segments in both species (similar to a dot plot). PipMaker is appropriate for comparing genomic sequences from any two related species, although the types of information that can be inferred (e.g., protein-coding regions and cis-regulatory elements) depend on the level of conservation and the time and divergence rate since the separation of the species. Gene regulatory elements are often detectable as similar, noncoding sequences in species that diverged as much as 100-300 million years ago, such as humans and mice, Caenorhabditis elegans and C. briggsae, or Escherichia coli and Salmonella spp. PipMaker supports analysis of unfinished or "working draft" sequences by permitting one of the two sequences to be in unoriented and unordered contigs.
| |
INTRODUCTION |
|---|
|
|
|---|
The availability of complete sequences of many
microbial genomes and the proposed sequencing of the human (Collins et
al. 1998![]() ; Marshall 1999
; Marshall 1999![]() ) and mouse (Battey et al. 1999
) and mouse (Battey et al. 1999![]() ) genomes are fueling a major revolution in the biological sciences (Lander 1996
) genomes are fueling a major revolution in the biological sciences (Lander 1996![]() ).
Comparative analysis based on alignments of these sequences is one
powerful tool for interpreting such genomic information. Such
alignments can help achieve several goals of postsequencing functional
analysis. These include determining all of the protein-coding segments
in both species, locating regulatory signals, understanding the
mechanisms and history of genome evolution, and deducing the similarities and
differences in gene organization between the species of interest.
).
Comparative analysis based on alignments of these sequences is one
powerful tool for interpreting such genomic information. Such
alignments can help achieve several goals of postsequencing functional
analysis. These include determining all of the protein-coding segments
in both species, locating regulatory signals, understanding the
mechanisms and history of genome evolution, and deducing the similarities and
differences in gene organization between the species of interest.
A variety of methods are available for identifying protein-coding
segments in genomic sequences, using approaches such as finding matches
to ESTs and analyzing the inherent properties of the DNA sequence
(Claverie 1997![]() ). The success rate of these methods when tested against
reference sequences can be high (Burge and Karlin 1997
). The success rate of these methods when tested against
reference sequences can be high (Burge and Karlin 1997![]() ; Bailey et al.
1998
; Bailey et al.
1998![]() ). However, some genes are difficult to find by these means. Novel
genes that are expressed at very low levels, or are transcribed in only
a few tissues and/or at a restricted time in development, may show no
matches to sequence databases (as well as resisting
experimental approaches).Despite their clear utility in
identifying many genes, EST databases generate a relatively high rate
of spurious matches (Bailey et al. 1998
). However, some genes are difficult to find by these means. Novel
genes that are expressed at very low levels, or are transcribed in only
a few tissues and/or at a restricted time in development, may show no
matches to sequence databases (as well as resisting
experimental approaches).Despite their clear utility in
identifying many genes, EST databases generate a relatively high rate
of spurious matches (Bailey et al. 1998![]() ). In addition, database
searches frequently miss some of a gene's exons. Current gene-finding
programs based on inherent sequence properties have different
deficiencies. They frequently work poorly for genes that are
alternatively spliced, overlap, or lie within another gene. This
limitation may be critical because according to one recent estimate
(Gelfand et al. 1999
). In addition, database
searches frequently miss some of a gene's exons. Current gene-finding
programs based on inherent sequence properties have different
deficiencies. They frequently work poorly for genes that are
alternatively spliced, overlap, or lie within another gene. This
limitation may be critical because according to one recent estimate
(Gelfand et al. 1999![]() ), at least 30% of all human genes are spliced
alternatively. Moreover, these methods are adversely affected by
sequencing errors and by interruptions in the sequence, which is a
serious deficiency for analysis of "working draft" sequences.
Utilizing interspecies alignments can improve the accuracy of exon
assignments (Jang et al. 1999
), at least 30% of all human genes are spliced
alternatively. Moreover, these methods are adversely affected by
sequencing errors and by interruptions in the sequence, which is a
serious deficiency for analysis of "working draft" sequences.
Utilizing interspecies alignments can improve the accuracy of exon
assignments (Jang et al. 1999![]() ; Liang et al. 1999
; Liang et al. 1999![]() ), and Bouck et al.
(1998)
), and Bouck et al.
(1998)![]() show that this technique is effective when applied to working
draft sequences.
show that this technique is effective when applied to working
draft sequences.
Finding candidates for gene regulatory elements is even more difficult
than identifying exons, because of the small size and (sometimes) low
sequence specificity of protein-binding sites on DNA. However, as
exemplified by work on both the HBB, BTK, and
IL-4/IL-13 loci, highly conserved, noncoding regions can be reliable guides to cis-regulatory elements (Gumucio et al.
1996![]() ; Hardison et al. 1997b
; Hardison et al. 1997b![]() ; Oeltjen et al. 1997
; Oeltjen et al. 1997![]() ; Cretu et al. 2000
; Cretu et al. 2000![]() ).
).
To provide tools for efficient identification of coding and regulatory
elements in genomic DNA by comparative analysis, we built an automated
server on the World-Wide Web. To accomplish this, several obstacles had
to be overcome. (1) The alignment program must be able to analyze long
sequence files, containing as many as millions of nucleotides.
Bacterial genomes can be up to 6 million nucleotides, as can the
regions of conserved syntenic loci in human and mouse chromosomes.
Alignment programs that utilize memory space proportional to the
sequence lengths allow such long files to be analyzed (Chao et al.
1994![]() ). (2) The alignment program must be very fast, and the series of
Blast programs achieve this goal (Altschul et al. 1990
). (2) The alignment program must be very fast, and the series of
Blast programs achieve this goal (Altschul et al. 1990![]() , 1997
, 1997![]() ). (3) The
enormous volume of output containing all local alignments between two
long sequences must be presented to the user in a compact,
understandable form. We have introduced percent identity plots (pips)
for this purpose (Hardison et al. 1997a
). (3) The
enormous volume of output containing all local alignments between two
long sequences must be presented to the user in a compact,
understandable form. We have introduced percent identity plots (pips)
for this purpose (Hardison et al. 1997a![]() ).
).
In this paper we describe an automated server for generating alignments and pips. A pip shows the position in one sequence of each aligning gap-free segment and plots its percent identity. As a complementary display, we also provide a plot of the position of each aligning segment in both species. We refer to these as dot plots, even though matches shown in conventional dot plots need not be contained within a statistically significant alignment and those in our plots are. Both displays allow rich annotation to be plotted along the appropriate axes to aid in correlating aligning segments with functional or structural features of the sequence. We provide examples of the application of PipMaker for finding exons and candidate regulatory elements in mammalian, nematode, and bacterial sequences. The server is able to compare a completed sequence from one species with an incomplete sequence from a second.
| |
RESULTS |
|---|
|
|
|---|
Accessing and Using PipMaker
PipMaker is accessed by pointing a web browser to
http://bio.cse.psu.edu, which is the menu page providing links to
instructions, examples, a basic server, and an advanced server. At
either PipMaker server page, the user submits two sequence files, using
the Browse function to select a file from the user's machine or by cut
and paste into the available windows. An additional file containing the
coordinates of interspersed repeats in the first sequence should also
be submitted to avoid uninformative and time-consuming alignments among
repeats. This Repeats file is generated by RepeatMasker (Smit and Green
1999![]() ) at http://ftp.genome.washington.edu/cgi-bin/RepeatMasker. An
optional Exons file contains the positions of known or predicted exons,
plus the name and transcriptional orientation of each gene. The
Advanced PipMaker page allows colors to be added to the plot by
supplying an Underlay file. Various options for generating the
alignments (see below) are also available.
) at http://ftp.genome.washington.edu/cgi-bin/RepeatMasker. An
optional Exons file contains the positions of known or predicted exons,
plus the name and transcriptional orientation of each gene. The
Advanced PipMaker page allows colors to be added to the plot by
supplying an Underlay file. Various options for generating the
alignments (see below) are also available.
PipMaker returns the alignments generated by BlastZ in any or all of four different formats: a pip, a dot plot, a conventional textual alignment, and a compact listing of the coordinates of the aligning segments. One can choose among these outputs from the Advanced PipMaker page. For the pip, the program plots the position (in the first sequence) and percent identity of each gap-free segment of the alignments (Figs. 1C and 2). The top horizontal axis is automatically decorated with the positions of repeats (from the Repeats file), and exons (from the Exons file). The positions of CpG islands are also computed and displayed along the top axis. The coordinates (lower horizontal axis) are the nucleotide positions in the first sequence. The image of the pip is rendered as a pdf file by default, although a PostScript file can be requested. The results are returned to the user via e-mail. The image files can be viewed and printed with GhostScript (pdf or PostScript files) or other widely distributed programs such as Adobe Acrobat Reader for pdf files.
|
|
Although pips are compact and highly informative about sequence features and aligning segments in the first sequence, they do not show the positions of the alignments in the second sequence. Thus, an interesting alignment displayed in a pip may involve a sequence that is in a different position or has been inverted in the second sequence. Such information is best conveyed in a traditional dot-plot display, where the positions of alignments in both sequences are shown as diagonal lines (Figs. 1D and 3).
|

An Example from Mammals
A 100-kb sequence from human chromosome 5q31 (Frazer et al. 1997![]() )
was extracted from GenBank entries
AC004500 and
AC004775. It was
analyzed by identifying repeats using the RepeatMasker program (Smit
and Green 1999
)
was extracted from GenBank entries
AC004500 and
AC004775. It was
analyzed by identifying repeats using the RepeatMasker program (Smit
and Green 1999![]() ), submitting the masked sequence to GenScan (Burge and
Karlin 1997
), submitting the masked sequence to GenScan (Burge and
Karlin 1997![]() ), and performing Blast searches (Altschul et al. 1997
), and performing Blast searches (Altschul et al. 1997![]() ) with
the masked sequence or portions thereof against the nucleotide, EST,
and protein sequence databases at NCBI. Information obtained from these
sources was manually merged in an attempt to identify genes.
) with
the masked sequence or portions thereof against the nucleotide, EST,
and protein sequence databases at NCBI. Information obtained from these
sources was manually merged in an attempt to identify genes.
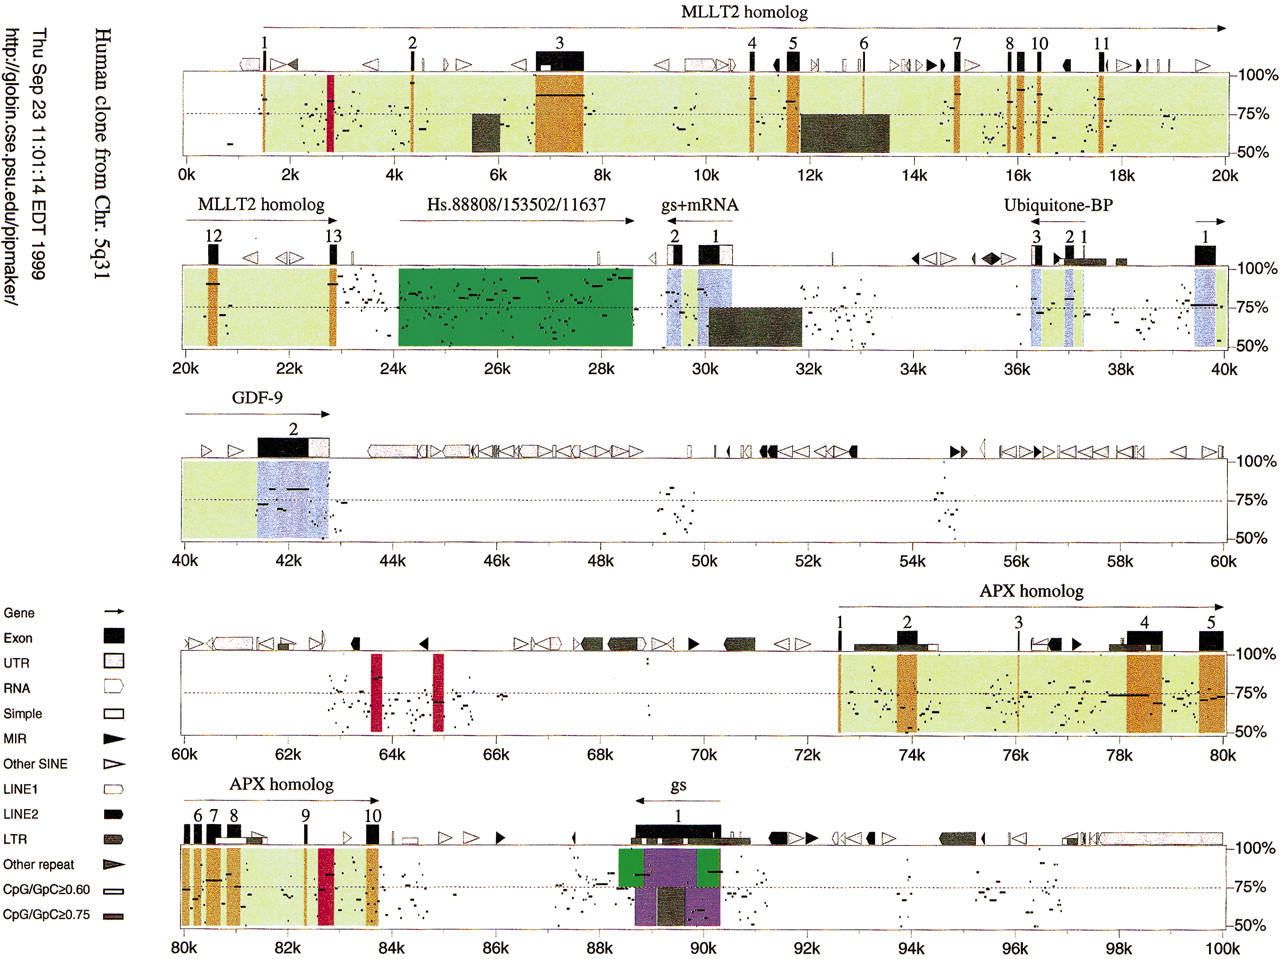
GenScan predicted six genes, which fell into three categories, depending on the nature of the database matches. Three of the GenScan predictions showed near identity with mRNA sequences in GenBank, two of which were for characterized genes (Ubiquitone-BP and GDF-9); the other was a full-insert mRNA sequence (GenBank accession no. AF143867). Conceptual translations of two other GenScan-predicted genes showed strong but not identical protein matches: one to a human protein named MLLT2 (GenBank accession no. NP_005926), and the other to the apical protein (APX) of Xenopus laevis (GenBank accession no. Q01613). GenScan also predicted a single-exon gene, portions of which match ESTs. A 4-kb region around positions 24-28K had numerous matches to the EST database but did not contain any GenScan-predicted exons or hits to other databases.
A pip showing the alignments between the 100-kb sequence from human chromosome 5q31 and its homolog in mouse is given in Figure 2. Features in the human sequence derived from analysis by Repeat Masker, GenScan predictions, and matches to ESTs are plotted along the top horizontal axis. The portions of the pip corresponding to exons with exact matches to GenBank mRNAs are in blue. Orange corresponds to exons of GenScan-predicted genes (MLLT2 and APX homologs), whose products have significant but not exact matches to other proteins. Purple indicates the single-exon gene predicted by GenScan. One can easily discern clustered repeats, presumably formed by recursive integration into closely linked sites, and more dispersed repetitive elements. Although the significance of these nonrandom distributions of repeats is currently not known, the inclusion of information about the positions and identity of repeats in the pips may aid in the discovery of informative correlations. The display also shows prominent CpG islands centered at ~37K, 74K, 78K, and 90K.
PipMaker provides useful sequence comparisons even when one of the sequences is unfinished. For example, the sequence in mouse that is homologous to this portion of human 5q31 has not been completed, but substantial portions are present as 14 separate contigs. PipMaker compares the completed human sequence against all 14 mouse sequences. The dot plot (Fig. 3), which is a complementary display of exactly the same alignments shown in the pip in Figure 2, shows the discontinuities in the mouse sequence more clearly. It also illustrates the fact that a given contig can be in either orientation relative to the completed sequence; this is an option on the Advanced PipMaker page. In the pip, these numerous matches are assembled in the order consistent with the completed human sequence. Inspection of the dot plot allows us to identify portions of the human sequence that fall between regions that align with separate mouse contigs. This absence of orthologous sequences in the available mouse data is indicated by the dark gray shading in Figures 2 and 3. The positions of the gray blocks were obtained from the user-supplied Underlay file.
Pips provide information complementary to GenScan and database hits for
finding exons. Protein-coding exons show an average percent identity of
~85% for many comparisons between human and mouse genes (Makalowski
and Boguski 1998![]() ). This is illustrated in Figure 2, as the high percent
identity lines in the pip for almost all of the exons (see, e.g., the
MLLT2 homolog). Thus, when a high percent identity is found
in the same region as an exon predicted by GenScan, one has even more
confidence in that assignment. Putative exons 5-8 of the APX
homolog appear to be correct, whereas the remaining predicted exons are
suspect. The homolog to the GenScan-predicted exon ~90K has not been
sequenced completely in mouse; thus, the matches do not extend through
the entire predicted exon. In this case, the exon predicted by GenScan (purple portion of pip, Fig. 2) corresponds to EST hits (green portions) and high percent identity alignments to two of the mouse contigs. This convergence of assignments is easy to see in the pip. It
indicates that one should be confident of this exon assignment, even
without BlastN or BlastP hits to known genes or their products.
). This is illustrated in Figure 2, as the high percent
identity lines in the pip for almost all of the exons (see, e.g., the
MLLT2 homolog). Thus, when a high percent identity is found
in the same region as an exon predicted by GenScan, one has even more
confidence in that assignment. Putative exons 5-8 of the APX
homolog appear to be correct, whereas the remaining predicted exons are
suspect. The homolog to the GenScan-predicted exon ~90K has not been
sequenced completely in mouse; thus, the matches do not extend through
the entire predicted exon. In this case, the exon predicted by GenScan (purple portion of pip, Fig. 2) corresponds to EST hits (green portions) and high percent identity alignments to two of the mouse contigs. This convergence of assignments is easy to see in the pip. It
indicates that one should be confident of this exon assignment, even
without BlastN or BlastP hits to known genes or their products.
Another potential use for pips in exon assignments is illustrated by the region from 24K to 28.5K (Fig. 2). This segment of the human DNA shows many database matches to ESTs, including members of the three different UniGene clusters listed. This appears to be a complex region, and the fact that discrete segments are highly conserved in mouse can be incorporated into the analysis. For instance, one may want to focus attention on the EST matches that coincide with the higher scoring alignments with mouse.
Pips are useful not only for finding exons but also for distinguishing protein-coding regions from untranslated regions of the exons. For example, the 3'-untranslated region of GDF-9, indicated by a light gray box, shows a considerable decrease in percent identity (see the region from ~41.3Kto 42.7K in Fig. 2). This is characteristic of many untranslated regions. In addition, protein-coding portions of exons tend not to be broken by gaps (see the MLLT2 homolog portion of the pip), whereas the untranslated portions of exons have more gaps in the alignment, which produce a series of shorter horizontal lines.
Pips also reveal candidates for regulatory elements in regions that do
not encode mRNA. For instance, the aligning segments highlighted in red
around positions 2.8K, 63.7K, 64.8K, and 82.7K in Figure 2 stand out as
having high percent identities but do not coincide with any known or
predicted exons. Analysis of noncoding regions with high percent
identity has determined that frequently they are also conserved in
other mammals and unique in the human genome, which are two common
features of long-range regulatory elements (Cretu et al. 2000![]() ).
Functional characteristics of conserved noncoding sequences in the
BTK, HBB, and IL-4/IL-3 loci (Hardison et
al. 1997b
).
Functional characteristics of conserved noncoding sequences in the
BTK, HBB, and IL-4/IL-3 loci (Hardison et
al. 1997b![]() ; Oeltjen et al. 1997
; Oeltjen et al. 1997![]() , Cretu et al. 2000
, Cretu et al. 2000![]() ) have demonstrated that sequence conservation is a good predictor of regulatory elements.
) have demonstrated that sequence conservation is a good predictor of regulatory elements.
As illustrated in the dot plot (Fig. 3), the exons of a gene can be on different contigs. For instance, exon 1 of the mouse homolog to GDF-9 is on contig 38 and exon 2 is on contig 51. The Advanced PipMaker page includes a utility for joining the exons together into a putative coding sequence for each gene. In this process, the joining of the second incomplete sequence is guided by the matches to the first complete sequence. The putative coding sequences, returned by e-mail, can then be used in more thorough studies, such as an analysis of synonymous and nonsynonymous substitutions.
An Example from Nematodes
PipMaker need not be limited to comparisons between human and mouse
sequences. As an example of a comparison between two related nematode
species, Caenorhabditis elegans and Caenorhabditis
briggsae, Figure 4 shows the pip for the region
containing the bli-4 locus, using exon annotations from the
GenBank file. The bli-4 gene product proteolytically
activates a number of physiologically important polypeptides. Many, but
not all, of the putative exons show high percent identity matches. In
addition, three other strongly conserved segments are seen between
exons 12 and 14. The experimental analysis by Thacker et al. (1999)![]() shows that these three segments are alternatively spliced exons. In our
experience, it is not uncommon to identify previously unrecognized
exons by inspecting a pip.
shows that these three segments are alternatively spliced exons. In our
experience, it is not uncommon to identify previously unrecognized
exons by inspecting a pip.
|

An Example from Eubacteria: Escherichia coli vs. Salmonella typhimurium
The sequence of Escherichia coli K12 was completed in 1997 (Blattner et al. 1997![]() ). Two bacterial genera closely related to E. coli are Salmonella and Yersinia. The genomes
of Yersinia pestis and three species of Salmonella
have been "sample sequenced" at twofold coverage (for background,
see McClelland and Wilson 1998
). Two bacterial genera closely related to E. coli are Salmonella and Yersinia. The genomes
of Yersinia pestis and three species of Salmonella
have been "sample sequenced" at twofold coverage (for background,
see McClelland and Wilson 1998![]() ; Wong et al. 1999
; Wong et al. 1999![]() ). This results in
~90% of the genome being sequenced, but contained in many contigs,
currently unlinked. However, by aligning a Salmonella or
Yersinia sequence with the completed E. coli
sequence, much useful information can be gathered, in a fashion similar
to the comparison between human 5q31 and its multicontiguous mouse homolog.
). This results in
~90% of the genome being sequenced, but contained in many contigs,
currently unlinked. However, by aligning a Salmonella or
Yersinia sequence with the completed E. coli
sequence, much useful information can be gathered, in a fashion similar
to the comparison between human 5q31 and its multicontiguous mouse homolog.
A portion of the pip resulting from aligning the complete E. coli sequence with the Salmonella typhimurium sequence samples is shown in Figure 5. This shows matches in the protein-coding regions and intergenic regions for several genes linked in E. coli. Colors have a special meaning for this display (see legend to Fig. 5), illustrating the flexibility of this feature.
|
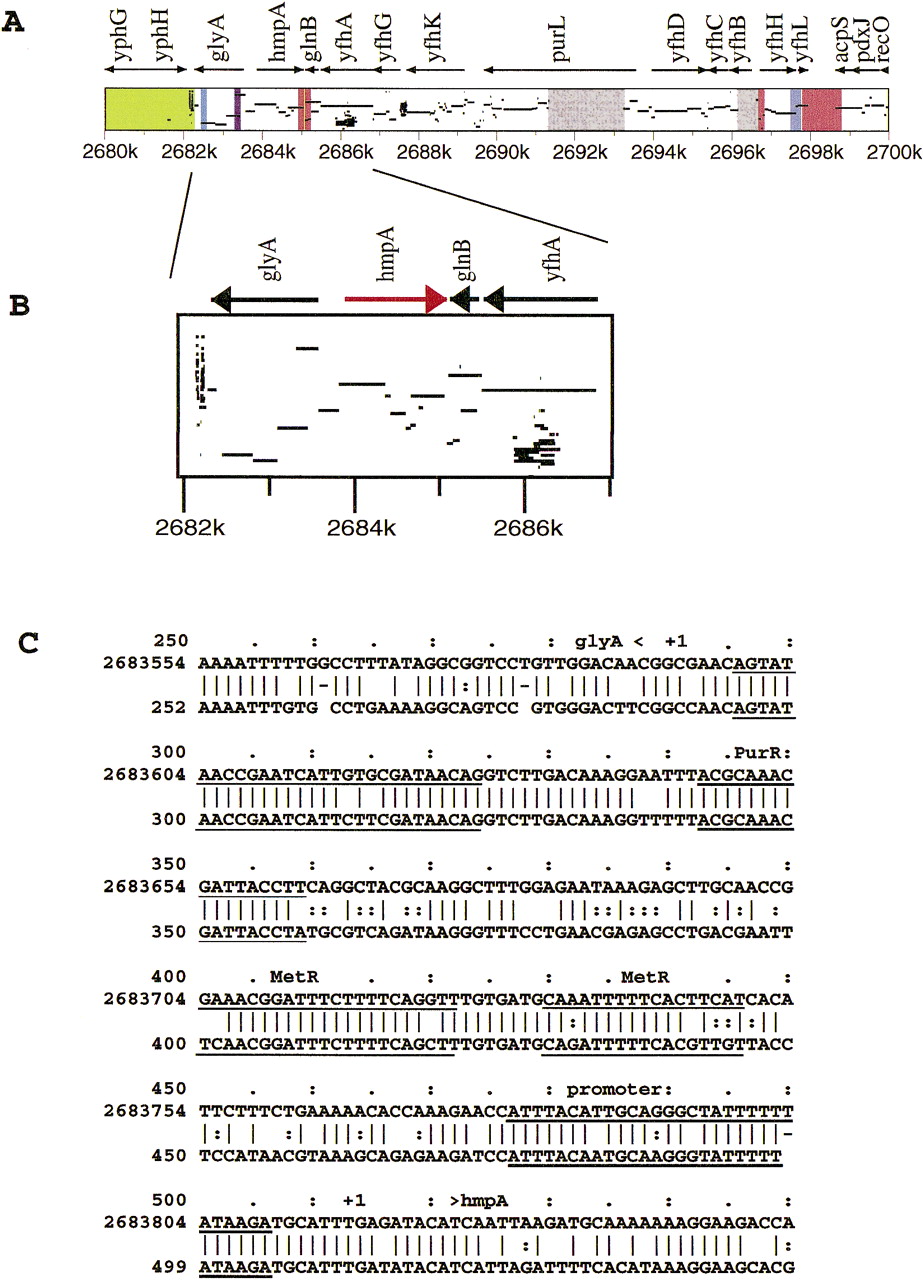
The matches in intergenic regions include those between the oppositely
transcribed glyA and hmpA genes. From the alignment shown in Figure 5C, one can see that the promoters for each gene are
conserved and long identical segments are seen between the promoters.
These conserved regions correspond to previously characterized binding
sites for PurR and MetR (Lorenz and Stauffer 1996![]() ), the latter of which
is involved in the induction of hmpA by nitric oxide
(Membrillo-Hernandez et al. 1998
), the latter of which
is involved in the induction of hmpA by nitric oxide
(Membrillo-Hernandez et al. 1998![]() ). This gene encodes a flavohemoglobin with a nitric oxide dioxygenase activity (Gardner et al. 1998
). This gene encodes a flavohemoglobin with a nitric oxide dioxygenase activity (Gardner et al. 1998![]() ; Hausladen et al. 1998
; Hausladen et al. 1998![]() ). In this intergenic region, all of the known functional
sites are conserved and the remaining portions are not, illustrating the power
of this approach for finding candidate regulatory elements.
). In this intergenic region, all of the known functional
sites are conserved and the remaining portions are not, illustrating the power
of this approach for finding candidate regulatory elements.
Advanced Features of PipMaker
Choice of Scoring Matrix
Users can choose different scoring matrices for BlastZ, appropriate for human versus mouse (i.e., where the first sequence is from human and the second is from mouse), mouse versus human, or other. The default scoring matrix seems to work acceptably for other combinations of two species, for instance, human-Fugu or human-human.Chaining
With the default setting of Show all matches, it is possible for one region of the first sequence to align with several regions of the second sequence because of duplications of a gene or an exon or because of incomplete masking of interspersed repeats or low-complexity regions. Such duplications cause lines to appear superimposed in the pip. The converse situation, where one region of the second sequence aligns with several regions in the first, also occurs but does not disrupt the pip. Advanced PipMaker provides two options for eliminating such duplicate matches, each with its own strengths and weaknesses. If the Chaining option is chosen, then PipMaker will identify and plot only matches that appear in the same relative order in the first and second sequences. This option should be used only if the genomic structures of the two sequences are known to be conserved; otherwise a duplication might not be detected. (An inversion of a segment in one of the two sequences might also go undetected unless the user chooses the Search both strands option.) For an example of chaining, consider the pip shown in Figure 6A. Exon 7 of the first sequence has a number of matches in the second sequence, due to duplications of that exon. The dot-plot view of the entire alignment (Fig. 6B) also shows the duplication (at around position 7000 on the horizontal axis), as well as duplications in later exons. Figure 6, C and D, shows the results of specifying the Chaining option.
|
Single Coverage
An alternative method for avoiding duplicate matches is provided by the Single coverage option, which selects a highest-scoring set of alignments such that any position in the first sequence can appear in one alignment, at most. (There is no guarantee that the order of matching regions is identical in the two sequences.) The three dot plots in Figure 7 show a case where this option works better than chaining. Figure 7A shows all matches in a gene cluster in which the first sequence has six copies of the gene and the second sequence has four. With chaining, only four of the genes can be matched, as shown in Figure 7B. The Single coverage option selects one match for each region of the first sequence (Fig. 7C).
|
| |
DISCUSSION |
|---|
|
|
|---|
The power and utility of interspecies comparisons of genomic sequences are now widely accepted, but accurate, easy-to-use tools for making such comparisons with very long DNA sequences have not been available. The PipMaker server now meets that need.
PipMaker uses the program BlastZ to compute local alignments. Comparing two sequences of ~150 kb each takes ~1 min. Although BlastZ can align sequences of virtually unlimited size, as a practical matter we have placed a limit of 2 million base pairs (each) on the files submitted to our web server.
The results displayed as pips are useful for finding exons and candidate regulatory elements, as well as following patterns of sequence changes during evolution. Pips have at least three advantages compared to conventional dot plots. First, they include information about the percent identity, so that higher-scoring alignments can be readily detected. Second, the occurrence of gaps within an alignment is more apparent when the percent identities of the two gap-free segments differ. Third, the alignment information is presented in a compact, but high-resolution, form.
Different kinds of information can be gleaned by comparisons of genomic
DNA sequences from species that diverged at progressively more distant
times. For instance, gene regulatory elements, frequently being less
well-conserved than protein-coding regions, are often identified most
easily using more closely related species. Interestingly, the estimated
times of divergence of several informative species pairs, such as
E. coli/Salmonella and human-mouse, fall at
~100 million years (Goodman et al. 1987![]() ; Ochman and Groisman 1994
; Ochman and Groisman 1994![]() ; Hedges et al. 1996
; Hedges et al. 1996![]() ; Ochman and Bergthorsson 1998
; Ochman and Bergthorsson 1998![]() ). Identification of
exons and protein-coding regions can utilize species that separated considerably long ago, such as human-Fugu. However,
different loci within a given species pair can show strikingly
different patterns of conservation (Koop 1995
). Identification of
exons and protein-coding regions can utilize species that separated considerably long ago, such as human-Fugu. However,
different loci within a given species pair can show strikingly
different patterns of conservation (Koop 1995![]() ; Hardison et al. 1997a
; Hardison et al. 1997a![]() ).
In a few mouse and human loci, such as those encoding the
).
In a few mouse and human loci, such as those encoding the  J segments of the T-cell receptor, some noncoding regions are more similar than
the protein-coding regions (Koop and Hood 1994
J segments of the T-cell receptor, some noncoding regions are more similar than
the protein-coding regions (Koop and Hood 1994![]() ). Analysis via PipMaker
makes these contrasting patterns quite obvious. As the human and mouse
sequences are completed, some general rules may emerge with the
potential to predict the patterns at other loci. However, currently one
has to approach this analysis on a locus-by-locus basis and investigate
the patterns empirically.
). Analysis via PipMaker
makes these contrasting patterns quite obvious. As the human and mouse
sequences are completed, some general rules may emerge with the
potential to predict the patterns at other loci. However, currently one
has to approach this analysis on a locus-by-locus basis and investigate
the patterns empirically.
The increasing availability of completed or very long genomic sequences from bacteria, fungi, plants, invertebrates, and vertebrates can be used to generate hypotheses about functions from the aligned sequences. This requires appropriate software for the analysis, and PipMaker should be a versatile tool to aid in this endeavor. This leads to the final phases of functional genomics, which are experimental tests of these hypotheses.
| |
METHODS |
|---|
|
|
|---|
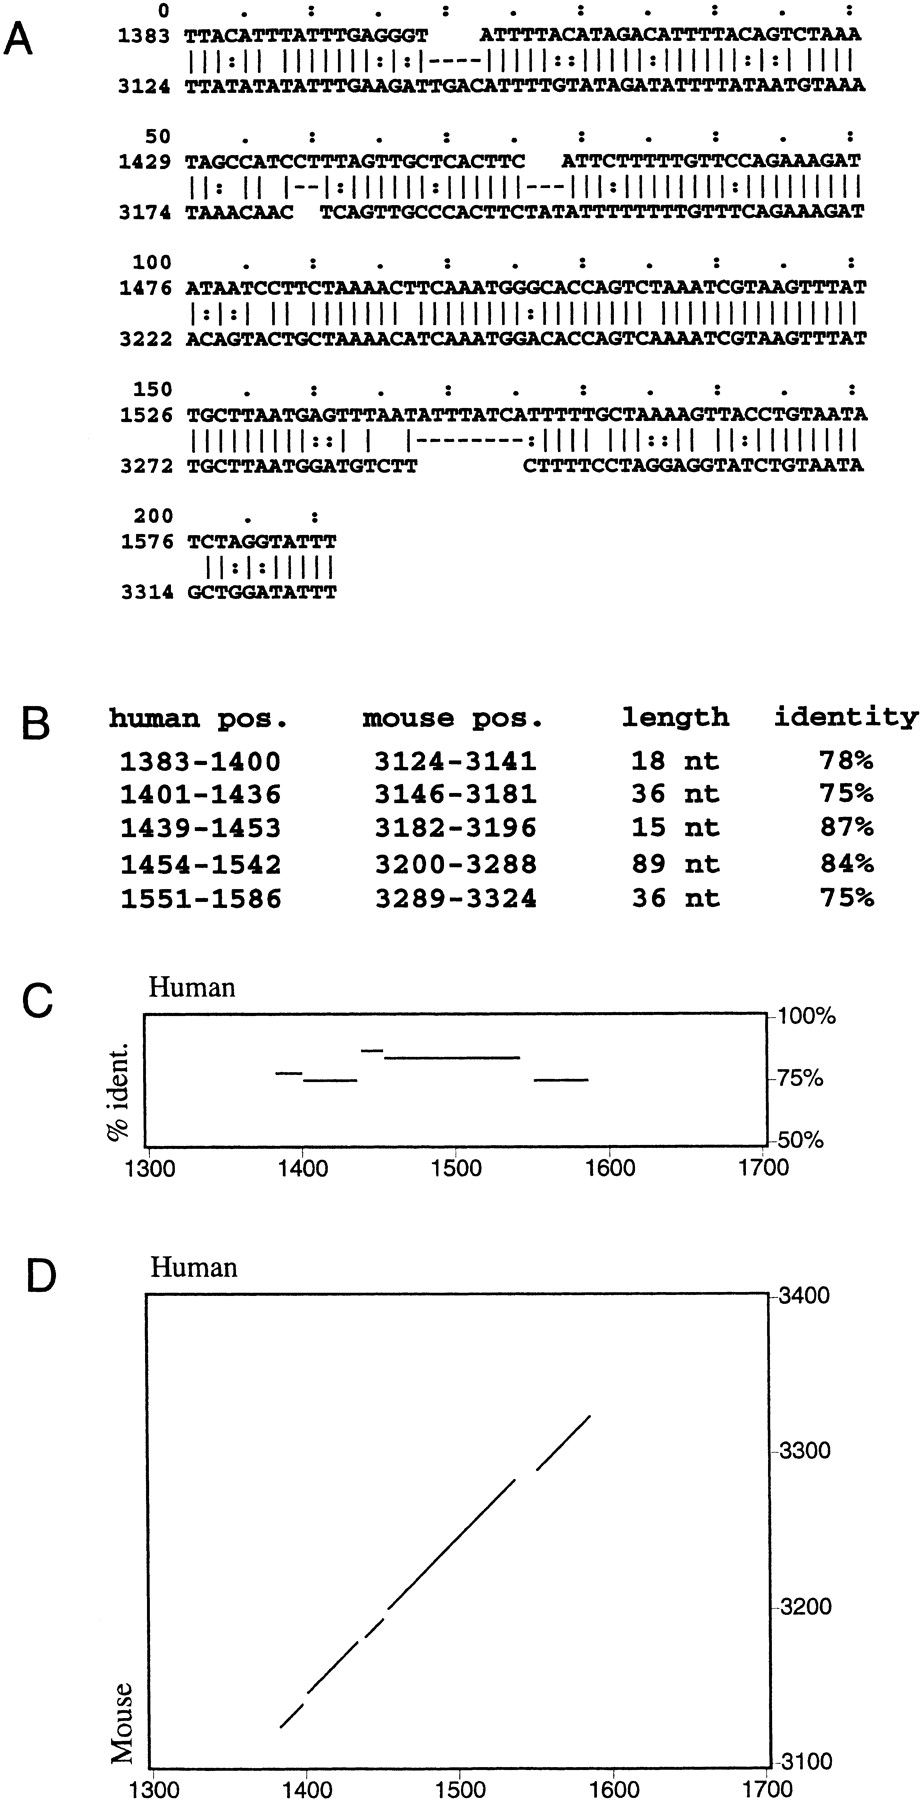
Description of Pips
Pips are perhaps best described with an example. Consider the human-mouse alignment in Figure 1A. Gaps divide the alignment into the five segments shown in Figure 1B. A pip depicts each one of these segments as a horizontal line, the left-to-right position of which is determined by the human coordinates and the vertical placement of which indicates the percent identity, as shown in Figure 1C. This alignment can be seen in Figure 2 around exon 1 of the gene labeled MLLT2 homolog. The dot plot of the same alignment, shown in Figure 1D, represents each of the gap-free segments as a diagonal line indicating position in both the human and mouse sequences but not the percent identity.
Computing Alignments
The alignment engine currently used by PipMaker, called BlastZ, is
an experimental variant of the Gapped Blast program (Altschul et al.
1997![]() ; Zhang et al. 1998
; Zhang et al. 1998![]() ). It is an entirely new implementation that has
been designed for aligning two very long sequences. The major
algorithmic improvement essentially guarantees that computer memory
will never be a constraining resource. (W. Miller, unpubl.)
). It is an entirely new implementation that has
been designed for aligning two very long sequences. The major
algorithmic improvement essentially guarantees that computer memory
will never be a constraining resource. (W. Miller, unpubl.)
Scoring Matrices
The default scoring parameters are match = 1,
mismatch = 1, gap open = 6, and gap
extension = 0.2. These empirically determined values have been
used in our alignment programs for 10 years, with reasonable success.
We now provide additional scoring matrices for aligning human and mouse
genomic sequences, determined in the following manner. We estimated
neutral nucleotide substitution patterns between human and mouse from
the 80,000 substitutions in alignments of 600 kb of human DNA
transposon fossils to their well-defined consensus sequences (A.F.A.
Smit, A. Kas, and P. Green, pers. comm.). For this estimate, we assumed
that neutral substitution biases were similar in rodent and primate
evolution and that the average substitution level since the
rodent-primate split is 18% in human DNA and 35% in mouse DNA (Li et
al. 1996
1, gap open = 6, and gap
extension = 0.2. These empirically determined values have been
used in our alignment programs for 10 years, with reasonable success.
We now provide additional scoring matrices for aligning human and mouse
genomic sequences, determined in the following manner. We estimated
neutral nucleotide substitution patterns between human and mouse from
the 80,000 substitutions in alignments of 600 kb of human DNA
transposon fossils to their well-defined consensus sequences (A.F.A.
Smit, A. Kas, and P. Green, pers. comm.). For this estimate, we assumed
that neutral substitution biases were similar in rodent and primate
evolution and that the average substitution level since the
rodent-primate split is 18% in human DNA and 35% in mouse DNA (Li et
al. 1996![]() ). Because the mutation biases depend on the GC richness of the
genomic region, log-odd scoring matrices were derived for queries of
different GC content. Furthermore, given the higher substitution level
in rodents, the scoring matrix is asymmetrical and different matrices are in use for human versus mouse than for mouse versus human comparisons. Details of our approach can be found at the PipMaker web site.
). Because the mutation biases depend on the GC richness of the
genomic region, log-odd scoring matrices were derived for queries of
different GC content. Furthermore, given the higher substitution level
in rodents, the scoring matrix is asymmetrical and different matrices are in use for human versus mouse than for mouse versus human comparisons. Details of our approach can be found at the PipMaker web site.
Removing Duplicate Alignments
We have implemented two methods for removing redundant alignments
between DNA sequences that are repeated in either or both sequences,
such as duplicated genes. For selecting a set of alignments that forms
a chain, that is, where the start point for each alignment follows (in
both sequences) the end point of the preceding alignment, we used the
method of Zhang et al. (1994)![]() . We prefer this algorithm to
theoretically faster methods because it easily accommodates small
overlaps between adjacent alignments and permits a variety of "gap
penalties" to be charged for offsets between two adjacent alignments
in an optimal chain.
. We prefer this algorithm to
theoretically faster methods because it easily accommodates small
overlaps between adjacent alignments and permits a variety of "gap
penalties" to be charged for offsets between two adjacent alignments
in an optimal chain.
An alternative option in PipMaker is to find a highest scoring set of alignments subject to the constraint that no two cover the same position in the first sequence (see the Single coverage option described above). A straightforward algorithm solves this problem in time 0(N log N), where N denotes the number of initial alignments.
| |
ACKNOWLEDGMENTS |
|---|
This work was supported by the National Library of Medicine (grants RO1LM05110 and RO1LM05773) and National Institutes of Health (grant RO1DK27635).
The publication costs of this article were defrayed in part by payment of page charges. This article must therefore be hereby marked "advertisement" in accordance with 18 USC Section 1734 solely to indicate this fact.
| |
FOOTNOTES |
|---|
6 Corresponding author.
E-MAIL webb@cse.psu.edu; FAX (814) 865-3176.
| |
REFERENCES |
|---|
|
|
|---|
-
Altschul, S.F.,
W. Gish,
W. Miller,
E.W. Myers, and
D.J. Lipman.
1990.
Basic local alignment search tool.
J. Mol. Biol.
215:
403-410
[Medline]. - Altschul, S.F., T.L. Madden, A.A. Schaffer, J. Zhang, Z. Zhang, W. Miller, and D.J. Lipman. 1997. Gapped BLAST and PSI-BLAST: A new generation of protein database search programs. Nucleic Acids Res. 25: 3389-3402
[Medline]. - Bailey, L.C., Jr., D.B. Searls, and G.C. Overton. 1998. Analysis of EST-driven gene annotation in human genomic sequence. Genome Res. 8: 362-376
[Abstract/Full Text]. - Battey, J., E. Jordan, D. Cox, and W. Dove. 1999. An action plan for mouse genomics. Nat. Genet. 21: 73-75
[Medline]. - Blattner, F.R., G. Plunkett, III, C.A. Bloch, N.T. Perna, V. Burland, M. Riley, J. Collado-Vides, J.D. Glasner, C.K. Rode, G.F. Mayhew 1997. The complete genome sequence of Escherichia coli K-12. Science 277: 1453-1474
[Abstract/Full Text]. - Bouck, J., W. Miller, J.H. Gorrell, D. Muzny, and R.A. Gibbs. 1998. Analysis of the quality and utility of random shotgun sequencing at low redundancies. Genome Res. 8: 1074-1084
[Abstract/Full Text]. - Burge, C. and S. Karlin. 1997. Prediction of complete gene structures in human genomic DNA. J. Mol. Biol. 268: 78-294
[Medline]. - Chao, K.-M., R. Hardison, and W. Miller. 1994. Recent developments in linear-space alignment methods: A survey. J. Comput. Biol. 1: 271-291
[Medline]. - Claverie, J.-M. 1997. Computational methods for the identification of genes in vertebrate genomic sequences. Hum. Mol. Genet. 6: 1735-1744
[Medline]. - Collins, F.S., A. Patrinos, E. Jordan, A. Chakravarti, R. Gesteland, and L. Walters. 1998. New goals for the U.S. Human Genome Project: 1998-2003. Science 282: 682-689
[Abstract/Full Text]. - Cretu, G., R. Locksley, C. Brion, Z.-E. Wang, W. Miller, E.M. Rubin, and K.A. Frazer. 2000. Cross-species non-coding sequence comparisons identify a coordinate regulator of interleukins 4, 5, and 13. Science (in press).
- Frazer, K.A., Y. Ueda, Y. Zhu, V.R. Gifford, M.R. Garofalo, N. Mohandas, C.H. Martin, M.J. Palazzolo, J.F. Cheng, and E.M. Rubin. 1997. Computational and biological analysis of 680 kb of DNA sequence from the human 5q31 cytokine gene cluster region. Genome Res. 7: 495-512
[Abstract/Full Text]. - Gardner, P.R., A.M. Gardner, L.A. Martin, and A.L. Salzman. 1998. Nitric oxide dioxygenase: An enzymic function for flavohemoglobin. Proc. Natl. Acad. Sci. 95: 10378-10383
[Abstract/Full Text]. - Gelfand, M.S., I. Dubchak, I. Dralyuk, and M. Zorn. 1999. ASDB: Database of alternatively spliced genes. Nucleic Acids Res. 27: 301-302
[Medline]. - Goodman, M., J. Czelusniak, B. Koop, D. Tagle, and J. Slightom. 1987. Globins: A case study in molecular phylogeny. Cold Spring Harbor Symp. Quant. Biol. 52: 875-890
[Medline]. - Gumucio, D., D. Shelton, W. Zhu, D. Millinoff, T. Gray, J. Bock, J. Slightom, and M. Goodman. 1996. Evolutionary strategies for the elucidation of cis and trans factors that regulate the developmental switching programs of the
 -like globin genes.
Mol. Phylog. and Evol.
5:
18-32
-like globin genes.
Mol. Phylog. and Evol.
5:
18-32[Medline]. - Hardison, R., J. Oeltjen, and W. Miller. 1997a. Long human-mouse sequence alignments reveal novel regulatory elements: A reason to sequence the mouse genome. Genome Res. 7: 959-966
[Medline]. - Hardison, R., J.L. Slightom, D.L. Gumucio, M. Goodman, N. Stojanovic, and W. Miller. 1997b. Locus control regions of mammalian
-globin gene clusters: Combining phylogenetic analyses and experimental results to gain functional insights.
Gene
205:
73-94[Medline]. - Hausladen, A., A.J. Gow, and J.S. Stamler. 1998. Nitrosative stress: Metabolic pathway involving the flavohemoglobin. Proc. Natl. Acad. Sci. 95: 14100-14105
[Abstract/Full Text]. - Hedges, S.B., P.H. Parker, C.G. Sibley, and S. Kumar. 1996. Continental breakup and the ordinal diversification of birds and mammals. Nature 381: 226-229
[Medline]. - Jang, W., A. Hua, S.V. Spilson, W. Miller, B.A. Roe, and M.H. Meisler. 1999. Comparative sequence of human and mouse BAC clones from the mnd2 region of chromosome 2p13. Genome Res. 9: 53-61
[Abstract/Full Text]. - Koop, B.F. 1995. Human and rodent sequence comparisons: A mosaic model of genomic evolution. Trends Genet. 11: 367-371
[Medline]. - Koop, B.F. and L. Hood. 1994. Striking sequence similarity over almost 100 kilobases of human and mouse T-cell receptor DNA. Nat. Genet. 7: 48-53
[Medline]. - Lander, E.S. 1996. The new genomics: Global views of biology. Science 274: 536-539
[Full Text]. - Li, W., D. Ellsworth, J. Krushkal, B. Chang, and D. Hewett-Emmett. 1996. Rates of nucleotide substitution in primates and rodents and the generation-time effect hypothesis. Mol. Phylogenet. Evol. 5: 182-187
[Medline]. - Liang, Y., A. Wang, I. Belyantseva, D. Anderson, F.J. Probst, T.D. Barber, W. Miller, J. Touchman, L. Jin, S. Sullivan 1999. Structure and expression of the human and mouse novel unconventional myosin XV genes responsible for hereditary deafness, DFNB3 and shaker-2. Genomics 61: 243-258
[Medline]. - Lorenz, E. and G.V. Stauffer. 1996. RNA polymerase, PurR and MetR interactions at the glyA promoter of Escherichia coli. Microbiology 142: 1819-1824
[Abstract]. - Makalowski, W. and M.S. Boguski. 1998. Evolutionary parameters of the transcribed mammalian genome: An analysis of 2,820 orthologous rodent and human sequences. Proc. Natl. Acad. Sci. 95: 9407-9412
[Abstract/Full Text]. - Marshall, E. 1999. Human Genome Project. Sequencers endorse plan for a draft in 1 year. Science 284: 1439-1441
[Full Text]. - McClelland, M. and R.K. Wilson. 1998. Comparison of sample sequences of the Salmonella typhi genome to the sequence of the complete Escherichia coli K-12 genome. Infect. Immun. 66: 4305-4312
[Abstract/Full Text]. - Membrillo-Hernandez, J., M.D. Coopamah, A. Channa, M.N. Hughes, and R.K. Poole. 1998. A novel mechanism for upregulation of the Escherichia coli K-12 hmp (flavohemoglobin) gene by the "NO releaser," S-nitrosoglutathione: Nitrosation of homocysteine and modulation of MetR binding to the glyA-hmp intergenic region. Mol. Microbiol. 29: 1101-1112
[Medline]. - Ochman, H. and U. Bergthorsson. 1998. Rates and patterns of chromosome evolution in enteric bacteria. Curr. Opin. Microbiol. 1: 580-583
. - Ochman, H. and E.A. Groisman. 1994. The origin and evolution of species differences in Escherichia coli and Salmonella typhimurium. Exs 69: 479-493
[Medline]. - Oeltjen, J.C., T.M. Malley, D.M. Muzny, W. Miller, R.A. Gibbs, and J.W. Belmont. 1997. Large-scale comparative sequence analysis of the human and murine Bruton's tyrosine kinase loci reveals conserved regulatory domains. Genome Res. 7: 315-329
[Abstract/Full Text]. - Smit, A. and P. Green. 1999. RepeatMasker at http://ftp.genome.washington.edu/RM/RepeatMasker.html.
- Thacker, C., M.A. Marra, A. Jones, D.L. Baillie, and A.M. Rose. 1999. Functional genomics in Caenorhabditis elegans: An approach involving comparisons of sequences from related nematodes. Genome Res. 9: 348-359
[Abstract/Full Text]. - Wong, R.M., K.K. Wong, N.R. Benson, and M. McClelland. 1999. Sample sequencing of a Salmonella typhimurium LT2 lambda library: Comparison to the Escherichia coli K12 genome. FEMS Microbiol. Lett. 173: 411-423
[Medline]. - Zhang, Z., P. Berman, and W. Miller. 1998. Alignments without low-scoring regions. J. Comput. Biol. 5: 197-210
[Medline]. - Zhang, Z., B. Raghavachari, R. Hardison, and W. Miller. 1994. Chaining multiple-alignment blocks. J. Comput. Biol. 1: 217-226
[Medline]. - Altschul, S.F., T.L. Madden, A.A. Schaffer, J. Zhang, Z. Zhang, W. Miller, and D.J. Lipman. 1997. Gapped BLAST and PSI-BLAST: A new generation of protein database search programs. Nucleic Acids Res. 25: 3389-3402
Received September 29, 1999; accepted in revised form February 1, 2000.
10:577-586 ©2000 by Cold Spring Harbor Laboratory Press ISSN 1088-9051/00 $5.00